

Volume 115, Nº 1, July 2020
DOI: https://doi.org/10.36660/abc.20190281
ORIGINAL ARTICLE
Assessing Dynamic Atrioventricular Conduction Time to RR-interval Coupling in Athletes and Sedentary Subjects
Paulo Roberto Benchimol-Barbosa
Olivassé Nasario-Junior
Jurandir Nadal
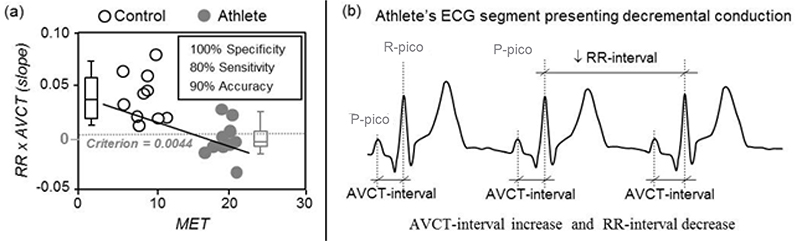
Figure 2 – (a) Regression line slope values of pooled AVCT vs. mean RR-intervals (RR-AVCTslope) as a function of VO2 consumption expressed as maximal metabolic equivalent (MET) achieved during stress test and respective boxplot. Note that RR-AVCTslope tends to be more negative as physical conditioning status increases (grey dots), when compared to sedentary individuals (white dots). Box-plots showing median, interquartile range and 95% confidence intervals are shown in the vicinity of the respective group points. Specificity, sensitivity and accuracy values were computed utilizing RR-AVCTslope = 0.0044 as a cut-off criterion. (b) Illustration of 19 y.o. Athlete’s ECG segment depicting a sequence of normal sinus beats showing AVCT lengthening as RR-interval decreases, indicating AV decremental conduction. Note P-wave and R wave peaks taken as the fiducial points for assessment of the PR-peak interval. AVCT was assessed as PR peak interval. AVCT – atrioventricular conduction time (see text for details).
Abstract
Background: Atrioventricular conduction time (AVCT) is influenced by autonomic input and subject to physiological remodeling.
Objective: To evaluate beat-by-beat AVCT and RR-interval variability in athletes and healthy sedentary subjects.
Methods: Twenty adults, including 10 healthy sedentary (Controls) and 10 elite long-distance runners (Athletes), age, weight and height-adjusted, underwent maximal metabolic equivalent (MET) assessment, and 15-min supine resting ECG recording seven days later. The interval between P-wave and R-wave peaks defined the AVCT. Mean (M) and standard deviation (SD) of consecutive RR-intervals (RR) and coupled AVCT were calculated, as well as regression lines of RR vs. AVCT (RR-AVCT). Concordant AV conduction was defined as positive RR-AVCT slope and discordant otherwise. A multivariate linear regression model was developed to explain MET based on AVCT and RR-interval variability parameters. Significance-level: 5 %.
Results: In Athletes, M-RR and SD-RR values were higher than in Controls, whereas M-AVCT and SD-AVCT were not. RR-AVCT slopes were, respectively, 0.038 ± 0.022 and 0.0034 ± 0.017 (p < 0.05). Using a cut-off value of 0.0044 (AUC 0.92 ± 0.07; p < 0.001), RR-AVCT slope showed 100% specificity and 80% sensitivity. In a multivariate model, SD-RR and RR-AVCT slope were independent explanatory variables of MET (F-ratio: 17.2; p < 0.001), showing 100% specificity and 90% sensitivity (AUC 0.99 ± 0.02; p < 0.001).
Conclusion: In elite runners, AVCT to RR-interval dynamic coupling shows spontaneous discordant AV conduction, characterized by negative AVCT vs. RR-interval regression line slope. RR-intervals standard deviation and AVCT vs. RRinterval regression line slope are independent explanatory variables of MET (Arq Bras Cardiol. 2020; 115(1):71-77)
Keywords: Athletes; Adults; Resistance Training; Physical Fitness; Ventricular Remodeling; Sedentarism; Electrocardiography/methods; Heart Ventricles; Ventricular Function.