

Volume 114, Nº 3, March 2020
DOI: https://doi.org/10.36660/abc.20180403
ORIGINAL ARTICLE
Software for Post-Processing Analysis of Strain Curves: The D-Station
Rafael Duarte de Sousa
Carlos Danilo Miranda Regis
Ittalo dos Santos Silva
Paulo Szewierenko
Renato de Aguiar Hortegal
Henry Abensur
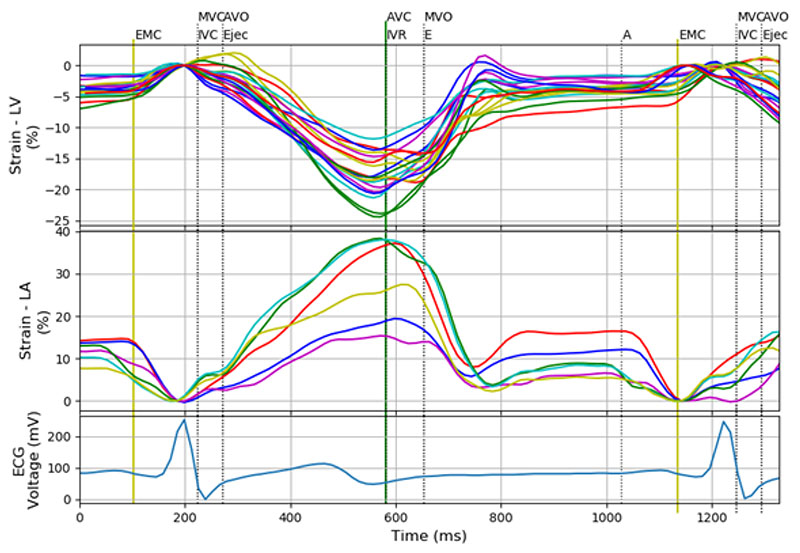
Figure 2 – Left ventricular strain, left atrial strain, and echocardiographic curves with division into cardiac cycle phases. Eighteen strain curves corresponding to 18 segments of the left ventricle, six left atrial strain curves, and one electrocardiographic signal. Colors of the strain and strain rate curves correspond to those attributed to the segments by the proprietary software; MVC: mitral valve closure; AVO: aortic valve opening; AVC: aortic valve closure; MVO: mitral valve opening.
Abstract
Background: The use of speckle-tracking echocardiography for evaluation of cardiac function has great applicability in different scenarios. The broad use of this method requires tools that allow the extraction of relevant data from strain curves and inclusion of these data in traditionally used parameters.
Objectives: The present study aimed to present and validate a free software, called D-station, for analysis of strain curves.
Methods: From raw data files, the D-Station determines the phases of the cardiac cycle, and simultaneously exhibits the strain and strain rate curves of different cardiac chambers. Validation of the software was done by global longitudinal strain (GLS), and the analyses were performed: 1) graphical comparison of EchoPAC and D-Station paired measurements in relation to equality line; 2) by coefficient of correlation of these measurements; 3) test of hypothesis (p > 0.05); and 4) Bland-Altman analysis.
Results: The Spearman’s rho correlation coefficient indicated a strong correlation between the measurements. Results of the test of hypothesis showed a p-value = 0.6798 >> 0.05, thus also indicating an equivalence between the softwares. The Bland-Altman analysis revealed a bias ≤ 1% and dispersion ≤ 2% between the measurements. The tests showed that, for GLS values lower than 10%, there was a trend for higher percentage difference between the values, although the absolute values remained low.
Conclusion: The D-Station software was validated as an additional tool to the EchoPAC, which uses the raw data from the strain and strain rate curves exported from a proprietary software. (Arq Bras Cardiol. 2020; 114(3):496-506)
Keywords: Cardiovascular Diseases/diagnostic imaging; Prognosis; Echocardiography/methods; Ventricular Dysfunction, Left/physiopathology; Speckle Tracking.