

Volume 113, Nº 2, August 2019
DOI: http://www.dx.doi.org/10.5935/abc.20190119
ORIGINAL ARTICLE
Global Longitudinal Strain Predicts Poor Functional Capacity in Patients with Systolic Heart Failure
Rafael José Coelho Maia
Simone Cristina Soares Brandão
Jéssica Leite
Giordano Bruno Parente
Filipe Pinheiro
Bruna Thays Santana Araújo
Maria Inês Remígio Aguiar
Sílvia Marinho Martins
Daniella Cunha Brandão
Armele Dornelas de Andrade
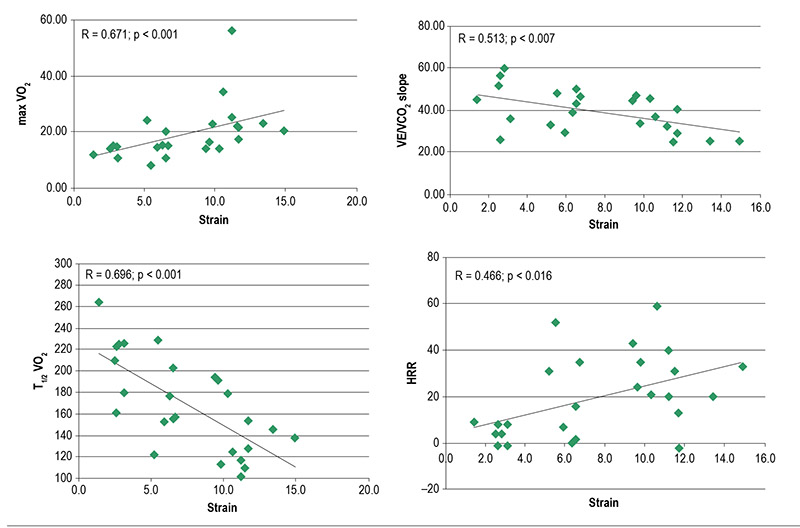
Figure 1 – Global longitudinal strain index (GLS) scatter plots compared to maxVO2, VE/VCO2 slope, HRR, and T1/2VO2. maxVO2: maximal oxygen consumption; VE/VCO2 slope: slope of the VE/VCO2 curve; HRR: heart rate recovery; T1/2VO2: time to VO2 halving recovery.
Abstract
Background: Left ventricular global longitudinal strain value (GLS) can predict functional capacity in patients with preserved left ventricular ejection fraction (LVEF) heart failure (HF) and to assess prognosis in reduced LVEF HF.
Objetive: Correlate GLS with parameters of Cardiopulmonary Exercise Test (CPET) and to assess if they could predict systolic HF patients that are more appropriated to be referred to heart transplantation according to CPET criteria.
Methods: Systolic HF patients with LVEF < 45%, NYHA functional class II and III, underwent prospectively CPET and echocardiography with strain analysis. LVEF and GLS were correlated with the following CPET variables: maxVO2, VE/VCO2 slope, heart rate reduction during the first minute of recovery (HRR) and time needed to reduce maxVO2 in 50% after physical exercise (T1/2VO2). ROC curve analysis of GLS to predict VO2 < 14 mL/kg/min and VE/VCO2 slope > 35 (heart transplantation’s criteria) was performed.
Results: Twenty six patients were selected (age, 47 ± 12 years, 58% men, mean LVEF = 28 ± 8%). LVEF correlated only with maxVO2 and T1/2VO2. GLS correlated to all CPET variables (maxVO2: r = 0.671, p = 0.001; VE/VCO2 slope: r = –0.513, p = 0.007; HRR: r = 0.466, p = 0.016, and T1/2VO2: r = –0.696, p = 0.001). GLS area under the ROC curve to predict heart transplantation’s criteria was 0.88 (sensitivity 75%, specificity 83%) for a cut-off value of –5.7%, p = 0.03.
Conclusion: GLS was significantly associated with all functional CPET parameters. It could classify HF patients according to the functional capacity and may stratify which patients have a poor prognosis and therefore to deserve more differentiated treatment, such as heart transplantation. (Arq Bras Cardiol. 2019; 113(2):188-194)
Keywords: Heart Failure;Longitudinal Strain; Torsion,Mechanical; Torsion Abnormality; Ventricular Dysfunction, Left; Echocardiography, Doppler/methods.