

Volume 115, Nº 1, Supplement 1, July 2020
DOI: https://doi.org/10.36660/abc.20190363
CASE REPORT
Idiopathic Left-Bundle Branch Block and Unexplained Symptom At Exercise: A Case Report
Guilherme Veiga Guimarães
Edimar Alcides Bocchi
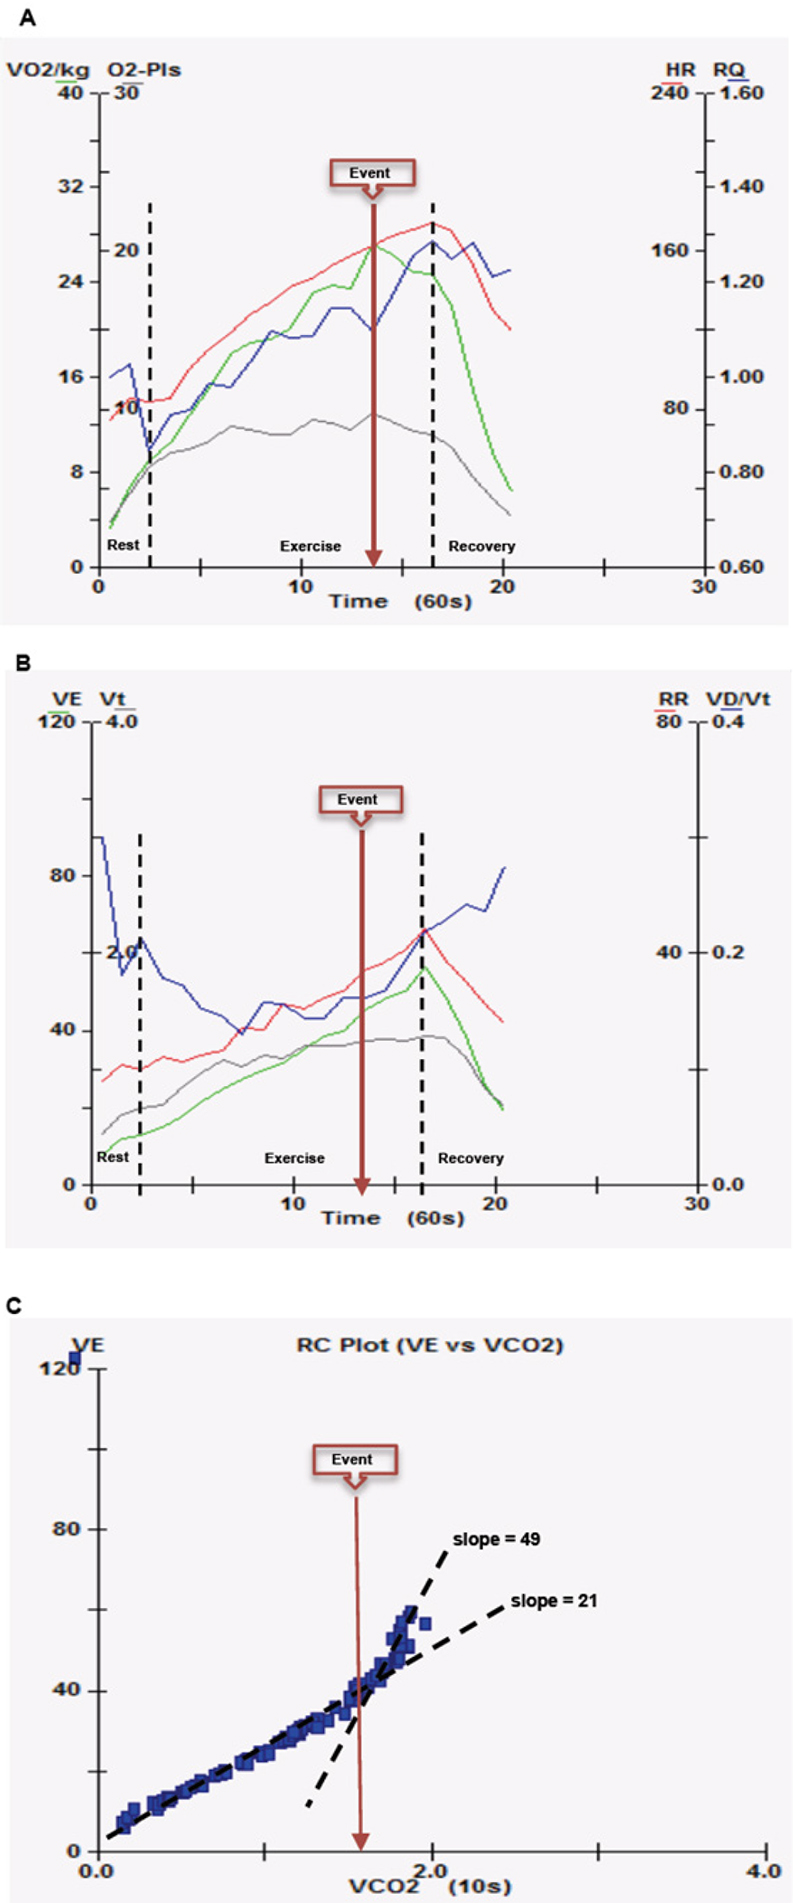
Figure 1 – Cardiopulmonary exercise test at rest, during exercise and recovery. The black lines indicate the transition between these phases. A) green line – oxygen consumption (VO2/kg, ml/kg/min), red line - heart rate (HR, bpm), black line - oxygen pulse (O2-Pls, ml/bpm) and blue line - respiratory coefficient (RQ); B) green line – minute ventilation (VE, l/min), red line - respiratory rate (RR, bpm), black line - tidal volume (Vt, ml/min) and blue line - dead space to tidal volume ratio (Vd/Vt). C) Minute ventilation/carbon dioxide production relationship slope (VE/VCO2 slope). In the first part of the exercise, VE/VCO2 slope is normal (21); from the event point during the exercise test, the VE/VCO2 slope severely increased (49). Brown line arrow - event point.
Keywords: Bundle Branch Block; Exercise; Physical Activity; Oxygen Consumption/physiology; Cardiovascular Diseases/prevention and control.