

Volume 112, Nº 6, June 2019
DOI: http://www.dx.doi.org/10.5935/abc.20190106
STATEMENT
Vascular Ultrasound Statement from the Department of Cardiovascular Imaging of the Brazilian Society of Cardiology – 2019
Simone Nascimento dos Santos
Monica Luiza de Alcantara
Cláudia Maria Vilas Freire
Armando Luis Cantisano
José Aldo Ribeiro Teodoro
Carmen Lucia Lascasas Porto
Salomon Israel do Amaral
Orlando Veloso
Ana Cristina Lopes Albricker
Ana Cláudia Gomes Pereira Petisco
Fanilda Souto Barros
Márcio Vinícius Lins Barros
Mohamed Hassan Saleh
Marcelo Luiz Campos Vieira
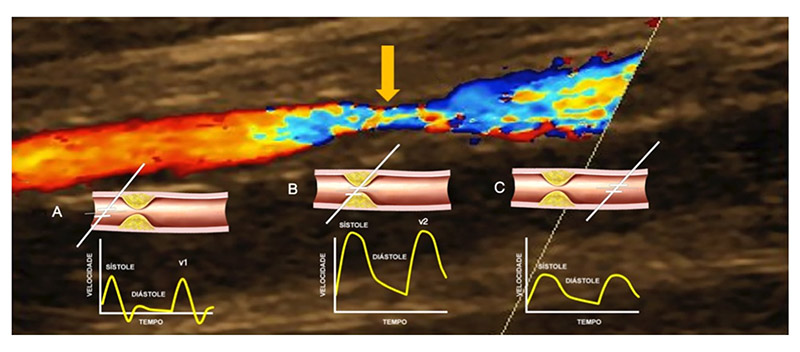
Figure 9 – Color flow imaging showing the flow proximal to the lesion in red and the turbulent flow at the lesion site (arrow). The diagrams A and C demonstrate the velocity spectrum with Doppler. (A) Cursor proximal to the lesion to measure V1. (B) Cursor at the lesion site to measure V2. (C) Cursor distal to the lesion with damped waveform.